Use of Epidemic Curves for characterising Outbreak Sources
Definition of outbreak types with examples:
- Point source
- Continuous common source
- Intermittent repeated common source (variant)
- Person to person transmission
- Point source followed by person to person transmission
- A common variation
Implications for analytical investigation (distinguishing early and late cases)
Early construction of epidemic curves, with even imprecise information about cases, may prevent mistaken assumptions at the outset regarding the outbreak source:
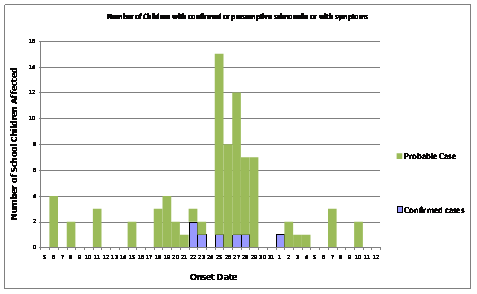
The graph below illustrates school absences from a primary school in London during a particularly intense period of norovirus (winter vomiting) activity in the wider community. Both school and public health investigators initially attributed the outbreak to norovirus infection. Somewhat later primary care doctors reported Salmonella infection in a small number of the children affected.
Retrospective construction of an epidemic curve, based on school absence records, suggested that the outbreak was in fact arising from a point source, rather than a continuous environmental source (norovirus activity in the community). (In this graph the occurrence of weekend days (for which there are no school absence reports) should be noted, 23/24 and 30/31). It also suggested some (expected) secondary transmission of cases within the school. Onset dates of the initial small number of known Salmonella cases also coincided with this period.
A retrospective cohort analysis based on school records for absences and whether children had meals at school or brought packed lunches from home (no other analysi was considered feasible at this point), showed that those who had the school lunch on the 21st or 22nd were 2.3 (95% CI 1.2 – 4.6) and 4.2(1.7- 10.4) times more likely to have been absent from school in the subsequent week than children who ate packed lunches on those dates.
Initial environmental officer review of the school kitchens had been satisfactory, although there was no consideration of the kitchen as a possible outbreak source at that time. If the epidemic curve had been constructed at the outset, a different focus to the investigation would have been followed, including a more intensive investigation of the school kitchen, including microbiological sampling of environment, food and possibly kitchen staff.
Figure: Epidemic curve of school absences, and (later) confirmed Salmonella cases, in a primary school, London, winter 2010. Source: Health Protection Agency
FEM PAGE CONTRIBUTORS 2007
- Editor
- Graham Fraser
- Original Authors
- Alain Moren
- Marta Valenciano
- Contributors
- Arnold Bosman
- Graham Fraser
- Lisa Lazareck
- Vladimir Prikazsky
Root > Assessing the burden of disease and risk assessment > Field Epidemiology > Outbreak Investigations > Describe the outbreak > Construction of Epidemic Curves
