Receiver operating curve
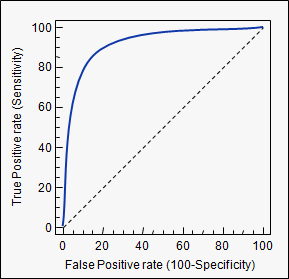
A receiver operating curve (ROC) is a plot of sensitivity versus 1-specificity. The name is derived from its original use in radar technology. The dotted line shown in the ROC curve represents a useless test that has no discriminatory power. The size of the area between the dotted line and the solid line in the ROC curve reflects the ability of a test to discriminate between diseased and non-diseased individuals across the range of potential cut-offs.
Contents
Traditional Operating Curve (ROC)
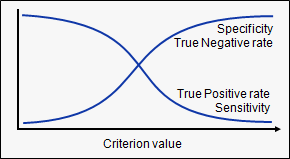
Another, perhaps more intuitive, way of displaying the same information is:
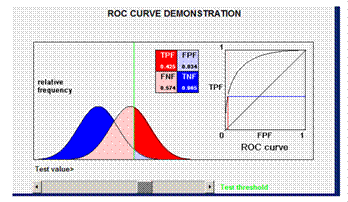
The following three examples of receiver operator curves are an illustration of the trade off when choosing a cutoff value. The examples are taken from: http:// www.anaesthetist.com/mnm/stats/roc/.
Example 1
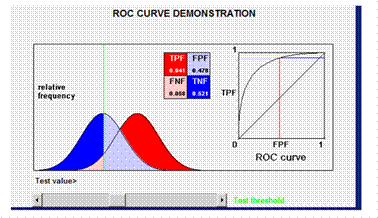
In this example the true positive fraction (TPF) and the false positive fraction (FPF) are shown. The curve in the box shows the value of sensitivity (FPF) and 1-specificity (FPF) according to various cutoff values.
The cutoff value is chosen to minimize missing true positives, thus including more false positives. ( for example: when consequences of missing a case are serious, e.g. testing potential blood donors for HIV).
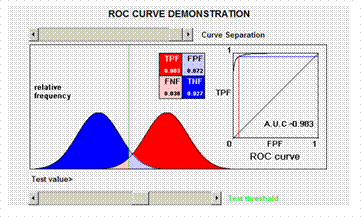
Example 2
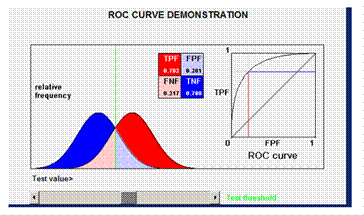
Cutoff value chosen at statistical mean. Equal number of true positive missed as the number of people diagnosed as false positive.
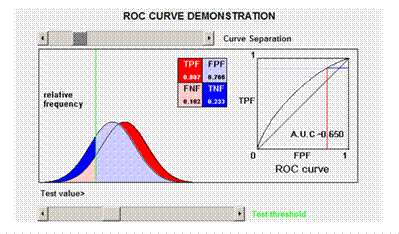
Example 3
Cutoff value chosen to minimize inclusion of false positives. (for example when treatment is expensive or invasive).
What matters is the relationship between true positives and the false positives. Where should we put the cutoff point for diagnosing a disease? The answer is not simple. There are many possible criteria on which to base a decision. These include:
- Financial costs both direct and indirect of treating a disease (present or not), and of failing to treat a disease
- Costs of further investigation (if appropriate)
- Side effects or complications caused by disease treatment, or failure to treat
- Mortality / severity associated with treatment or non-treatment
The best mathematical compromise for a cutoff value corresponds to a graph with the highest area under the ROC curve. The best compromise between sensitivity and specificity in this receiver operator curve corresponds to the point located at the highest left upper corner of the ROC curve. However other considerations than mathematical compromise apply:
- When doing prenatal screening for congenital toxoplasmosis false positive results have heavy consequences (interruption of pregnancy, treatment). Then specificity should be high to avoid false positive results.
- When screening for PKU (Guthrie test) at birth a false negative test would miss the disease when false positive results would only lead to a useless prevention which can be stopped later on. The aim is here a high sensitivity of the test.
- Blood screening for malaria needs a high sensitivity test in order to avoid all false negative even if some blood will be discarded due to false positives.
Choosing a cut off point is particularly difficult when the distribution of the measured value between the diseased and non diseased populations is small, resulting in a small area in the receiver operating curve.
Example 4
Large distribution of measured values between the diseased and the non-diseased populations make it easy to choose a cut off value.
Example 5
Small difference in distribution of measured values between the diseased and the non-diseased populations make it very difficult to choose a cut off value.
From the above we can see that the more the curve overlap the smaller will be the area under the ROC curve (which is a diagonal when the two curves fully overlap). In such a situation it may be that the test is useless and that an alternative test needs to be developed based on different parameters.
FEM PAGE CONTRIBUTORS 2007
- Editor
- Maarten Hoek
- Original Authors
- Julia Fitzner
- Alain Moren
- Contributors
- Lisa Lazareck
- Maarten Hoek
