Incidence rate
Incidence rate (synonym: incidence density rate) is expressed as the number of events per person-time
In a population that we may study over a predefined period of time, not every member of the population will be at risk of developing the disease for the same amount of time during the study period. Some individuals will develop disease soon and no longer be at risk of disease; some will die; some will be lost to follow-up; some will enter the population halfway through the study (birth, immigration), etc. The time contributed by each person is sometimes called “time at risk” (of an event occurring). As a consequence, the population contributing to time in the follow-up is also called “population at risk
Contents
Denominator
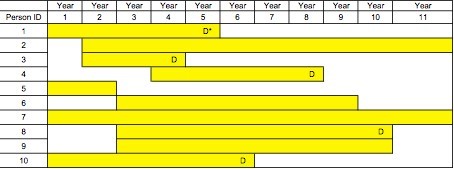
To measure the incidence rate of a disease in a population, we first need a denominator. The denominator is a measure of the time spent by each individual in the population at risk of developing illness during the study period. We then need to sum up all of the time at risk for each individual person to obtain a time denominator. The time in the denominator includes every instant an individual is at risk of developing the disease [1]. All time units in the denominator are equivalent regardless of whether they reflect the time contribution of the same person or of different persons. This way 10 people observed for exactly one year will contribute the same amount of time as 20 persons observed for 6 months. This is why the time at risk is frequently called person-time (e.g., person-years, person-months).
Numerator
For the numerator, we will count the number of events (e.g., disease onsets) occurring during the study period. Those events are occurring among people still contributing to time in the denominator when the event occurs. The event can be recurrent or not. According to the disease (and the immunity it may induce), people can develop the illness once and no longer be at risk, or several times and still be at risk. The time denominator will be computed accordingly and will be the summation of all times contributed by all persons at risk of developing disease[1]. Thus being part of a population at risk is a dynamic process.
The incidence rate measures the occurrence of disease onsets in a population per unit of follow-up time. Because of its similarity to population density, in an area, over time, it is sometimes called “incidence density rate”.
The figure illustrates the computation of the time contribution of 10 persons of a hypothetical population to the denominator of an incidence rate.
Figure. A graphical example of the occurrence of disease according to time at risk of developing the disease in a hypothetical population of 10 people (D*, Disease onset).
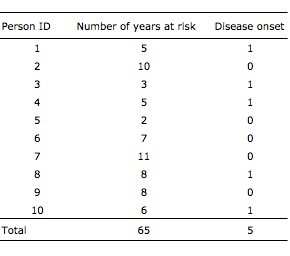
Table. Summary table of number of years at risk and disease onset in the same hypothetical population of 10 people.
Five disease onsets occurred during a total follow-up time of 65 years. This is equivalent to an incidence rate of 7.7 onsets per 100 years of follow-up of individuals being at risk of developing the disease.
Incidence rate: ( 5/65 persons years)= 0.07 x 100 = 7.7 per 100 persons-years
Alternatively, the incidence rate can be written as follows: 7.7 x 100 years -1
It is very common to multiply the rate per units of 100, 1,000, or 10,000 to make comparisons among studies and interpretations easier.
An incidence rate will range from 0 to infinity according to the unit of time used to express the person-time incidence. Among 100 people, no more than 100 deaths can occur. But those deaths can occur in 1000 person-years (if on average all 100 die after 10 years), 100 person-years (if on average all 100 die after 1 year), or even 1 person-year (if each of the 100 persons dies on average after 3.65 days). There is, therefore, no upper limit to an incidence rate. An incidence rate's numerical value is not interpretable by itself because it depends upon the unit of time chosen. This unit should be chosen to make sense. For example, 14 deaths per 10 person-year mean that a certain number of people (at least 14) were followed for periods of time (quite short), which equals 10 years. This rate is better expressed in months or days.
Incidence rate = 14 deaths per 10 person-years.
                        =  14           deaths per (10 x 12) 120 person-months
                        =  12.3         deaths per 100 person-months
                        =  14           deaths per ( 10 x 365) 3650 person-days
                        =  38,3         deaths per 10000 person-days
In an incidence rate, the only units involved are time units that appear in the denominator.
Risk (incidence proportion) can be interpreted as a probability, but the incidence rate cannot.
References
Credits
FEM Editor 2007
- Sabrina Bacci
Original Authors
- Alain Moren
- Marta Valenciano
- Arnold Bosman
FEM Contributors
- Vladimir Prikazsky
- Naomi Boxall
- Aileen Kitching
- Lisa Lazareck
- Sabrina Bacci
Root > Assessing the burden of disease and risk assessment > Field Epidemiology > Measurement in Field Epidemiology > Measures of Disease Occurrence

