Category:Refining the estimated point in time of an outbreak source
Construction of epidemic curves can, if the incubation period is known, suggest a potential point in time or time period for the exposure that caused the outbreak.
If the outbreak is due to a point source, the cases will be distributed across the range of incubation times for the infectious agent involved. The assumption may be made that the earlier cases had a shorter incubation time, and vice versa.
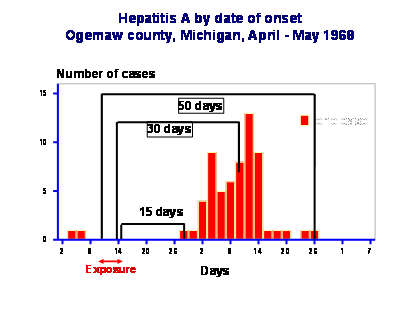
The following graph illustrates occurrence of onsets of hepatitis A in a city of Michigan in 1968. The median case of the cluster is likely to have been infected 30 days earlier (median incubation period for hepatitis A). The first case of the cluster cannot have been infected later than 15 days earlier (shortest incubation period). The last case of the cluster cannot have been infected sooner than 50 days earlier. This points to a period of exposure and infection ranging from 9 to 15 of April and allows us to focus investigation around those dates. (It will be noted that this analysis depends on the correctness of the assumption of a point source origin for the outbreak).
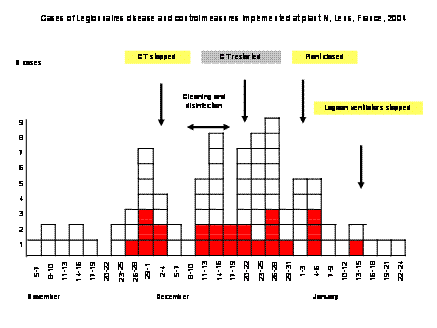
The following histogram shows occurrence of cases of Legionnaires diseases in Lens, France, in 2004, according to various environmental events and interventions. Several waves were observed.
Source: InVS, France
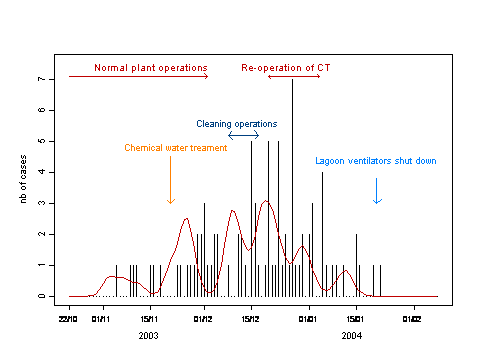
Using a back calculation procedure investigators identified several key periods of exposure that could be used to identify specific risk factors for transmission of Legionnaires disease among residents of Lens and surrounding areas. The term back-calculation comes from the fact that we estimate something that happened in the past. From onset we move back to exposure time.
Source: InVS, France
What is observed is the symptom onset date. Using available knowledge on the incubation period and its variability within individuals, one can infer or estimate the date of infection. The vertical bars of the graph are the observed cases by date of symptom onset. The red curve is the estimated infection curve obtained through modelling based on variation of incubation periods. Several peaks of infection can be identified within each wave of cases. This method was used to identify more precisely when exposure might have occurred and to evaluate effectiveness of prevention and control measures.
FEM PAGE CONTRIBUTORS 2007
- Editors
- Graham Fraser
- Original Authors
- Alain Moren
- Marta Valenciano
- Contributors
- Arnold Bosman
- Lisa Lazareck
- Graham Fraser
- Vladimir Prikazsky
Pages in category "Refining the estimated point in time of an outbreak source"
This category contains only the following page.


