Methods for setting thresholds in time series analysis: Difference between revisions
Bosmana fem (talk | contribs) (Created page with "Temporal analysis consists in identifying abnormal events in the temporal distribution of a disease. This can be straightforward for rare diseases requiring immediate notifica...") |
Bosmana fem (talk | contribs) mNo edit summary |
||
| Line 1: | Line 1: | ||
The temporal analysis identifies abnormal events in a disease's temporal distribution. This can be straightforward for rare diseases requiring immediate notification but often requires statistical methods to differentiate abnormal events from the expected fluctuation in notifications for diseases occurring at a baseline level in the community. | |||
Such statistical methods include, from the simplest to the most sophisticated: | Such statistical methods include, from the simplest to the most sophisticated: | ||
==Crossing a predefined threshold== | |||
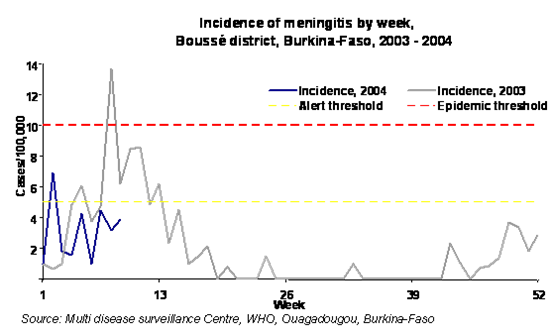
Crossing a predefined threshold, as for meningitis in the meningitis African belt (> 5 cases/100,000/week, Figure 1) | Crossing a predefined threshold, as for meningitis in the meningitis African belt (> 5 cases/100,000/week, Figure 1) | ||
Figure 1: Using a pre-defined threshold to detect unexpected changes | Figure 1: Using a pre-defined threshold to detect unexpected changes | ||
[[File:MeningitisbyweekBK.png|600px|frame|none]] | |||
==Doubling or tripling the absolute number of cases over a given time period== | |||
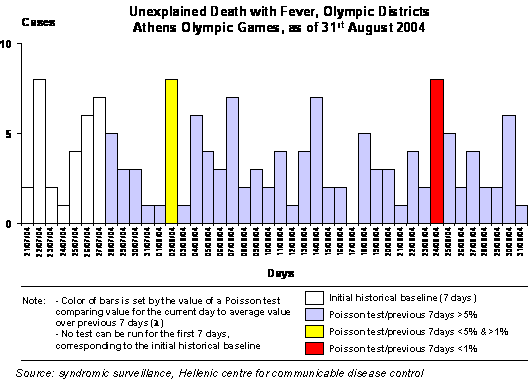
Doubling or tripling | Although simple, this method is crude because it does not consider the number of cases on which the increase is calculated. Doubling the number of cases from 10 to 20 carries a greater statistical significance than doubling the number from 3 to 6. As an alternative, to enhance the method, a Poisson test can be applied to express the departure from previous period values (figure 2). For example, the averaged value observed in the previous 5 weeks is the parameter expected in the Poisson test. The test returns the probability of observing the number of cases, or more, for the week to test, assuming the average value is expected. For example, if three cases, on average, have been notified weekly in the past five weeks, the probability of notifying six cases or more is 0.084 (8.4%) using a Poisson test. This means such an observation may occur by chance once every 12 weeks. Applying the same approach to 20 cases when only 10 are expected yields a probability of 0.0035 (0.35%), potentially occurring by chance only once every 6 years. | ||
Figure 2: Using a Poisson test to detect unexpected changes | Figure 2: Using a Poisson test to detect unexpected changes | ||
[[File:Poissontest.png|600px|frame|none]] | |||
==Comparing numbers, proportional morbidity, or rates with similar periods in the past.== | |||
Comparing | The mean or median of the number of cases observed on weeks from previous years, centered around the current week, are used as a basis for comparison (for example, five weeks for the past five years resulting in a historical distribution of 25 weeks). The departure from the historical mean is measured by comparing it to the standard deviation of the historical distribution. When the median is used, thresholds for the unusual patterns are defined by the value of the 90% or 95% percentile of the historical distribution (figure 3). This approach considers the seasonal variations by restricting the analysis to similar periods from past years but should not be applied to series presenting a significant trend. | ||
The mean or median of the number of cases observed on weeks from previous years, centered around the current week, are used as a basis for comparison (for example five weeks for the past five years resulting in | |||
Figure 3: Using historical median and percentiles to detect unexpected changes | Figure 3: Using historical median and percentiles to detect unexpected changes | ||
[[File:Historialmedian.png|600px|frame|none]] | |||
Modeling historical data by time series analysis techniques that will account for trends and seasonality in the data. | Modeling historical data by time series analysis techniques that will account for trends and seasonality in the data. | ||
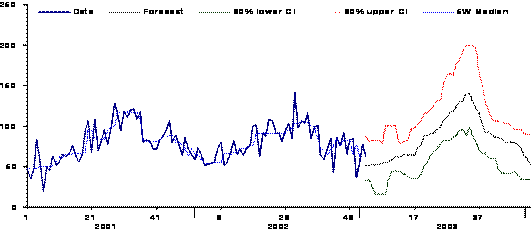
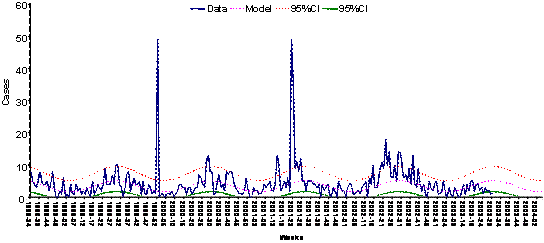
Regression techniques | Regression techniques account for trends and seasons by fitting lines and sine curves to the data (figure 4). The confidence interval for detecting unusual events relies on calculating the dispersion of the residuals and applying a statistical threshold (95% confidence interval). More advanced techniques using seasonal autoregressive and moving average models (SARIMA) on differentiated data are indicated for diseases with unstable historical patterns but are rarely used in routine surveillance (figure 5). | ||
Figure 4: Using periodic regression modeling to detect unexpected changes | Figure 4: Using periodic regression modeling to detect unexpected changes | ||
[[File:Periodicregression.png|600px|frame|none]] | |||
Figure 5: Using SARIMA modeling to detect unexpected changes | Figure 5: Using SARIMA modeling to detect unexpected changes | ||
[[File:Sarima.png|600px|frame|none]] | |||
Weekly notification of typhoid and paratyphoid fever in France, 1992-1996 | Weekly notification of typhoid and paratyphoid fever in France, 1992-1996 | ||
The selection of the most appropriate method for analysis of time | The selection of the most appropriate method for the analysis of time characteristics must take into account: | ||
The nature of the alert to detect | The nature of the alert to detect in relation to the type of transmission | ||
The availability of historical data. In a new system, historical comparisons can only be performed on the most recent periods | The availability of historical data. In a new system, historical comparisons can only be performed on the most recent periods and may not account for seasonality. | ||
The existing statistical resources and software | The existing statistical resources and software | ||
Revision as of 15:10, 18 December 2022
The temporal analysis identifies abnormal events in a disease's temporal distribution. This can be straightforward for rare diseases requiring immediate notification but often requires statistical methods to differentiate abnormal events from the expected fluctuation in notifications for diseases occurring at a baseline level in the community.
Such statistical methods include, from the simplest to the most sophisticated:
Crossing a predefined threshold
Crossing a predefined threshold, as for meningitis in the meningitis African belt (> 5 cases/100,000/week, Figure 1)
Figure 1: Using a pre-defined threshold to detect unexpected changes
Doubling or tripling the absolute number of cases over a given time period
Although simple, this method is crude because it does not consider the number of cases on which the increase is calculated. Doubling the number of cases from 10 to 20 carries a greater statistical significance than doubling the number from 3 to 6. As an alternative, to enhance the method, a Poisson test can be applied to express the departure from previous period values (figure 2). For example, the averaged value observed in the previous 5 weeks is the parameter expected in the Poisson test. The test returns the probability of observing the number of cases, or more, for the week to test, assuming the average value is expected. For example, if three cases, on average, have been notified weekly in the past five weeks, the probability of notifying six cases or more is 0.084 (8.4%) using a Poisson test. This means such an observation may occur by chance once every 12 weeks. Applying the same approach to 20 cases when only 10 are expected yields a probability of 0.0035 (0.35%), potentially occurring by chance only once every 6 years. Figure 2: Using a Poisson test to detect unexpected changes
Comparing numbers, proportional morbidity, or rates with similar periods in the past.
The mean or median of the number of cases observed on weeks from previous years, centered around the current week, are used as a basis for comparison (for example, five weeks for the past five years resulting in a historical distribution of 25 weeks). The departure from the historical mean is measured by comparing it to the standard deviation of the historical distribution. When the median is used, thresholds for the unusual patterns are defined by the value of the 90% or 95% percentile of the historical distribution (figure 3). This approach considers the seasonal variations by restricting the analysis to similar periods from past years but should not be applied to series presenting a significant trend. Figure 3: Using historical median and percentiles to detect unexpected changes
Modeling historical data by time series analysis techniques that will account for trends and seasonality in the data. Regression techniques account for trends and seasons by fitting lines and sine curves to the data (figure 4). The confidence interval for detecting unusual events relies on calculating the dispersion of the residuals and applying a statistical threshold (95% confidence interval). More advanced techniques using seasonal autoregressive and moving average models (SARIMA) on differentiated data are indicated for diseases with unstable historical patterns but are rarely used in routine surveillance (figure 5). Figure 4: Using periodic regression modeling to detect unexpected changes
Figure 5: Using SARIMA modeling to detect unexpected changes
Weekly notification of typhoid and paratyphoid fever in France, 1992-1996 The selection of the most appropriate method for the analysis of time characteristics must take into account:
The nature of the alert to detect in relation to the type of transmission The availability of historical data. In a new system, historical comparisons can only be performed on the most recent periods and may not account for seasonality. The existing statistical resources and software
FEM Editor 2007
- Denis Coulombier
Original FEM Authors
- Christophe Paquet
- Arnold Tarantola
- Philippe Quenel
- Nada Ghosn
FEM Contributors
- Denis Coulombier
- Vladimir Prikazsky
- Lisa Lazareck


