Receiver operating curve: Difference between revisions
Jump to navigation
Jump to search
Bosmana fem (talk | contribs) (Created page with " Category:Testing the Tests") |
Bosmana fem (talk | contribs) mNo edit summary |
||
| Line 1: | Line 1: | ||
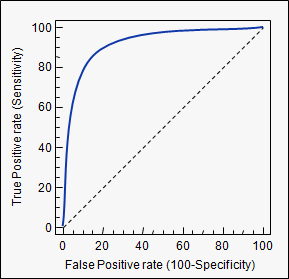
A receiver operating curve (ROC) is a plot of sensitivity versus 1-specificity. The name is derived from its original use in radar technology. The dotted line shown in the ROC curve represents a useless test that has no discriminatory power. The size of the area between the dotted line and the solid line in the ROC curve reflects the ability of a test to discriminate between diseased and non-diseased individuals across the range of potential cut-offs. | |||
===Traditional Operating Curve (ROC)=== | |||
[[File:7271.clip image001.gif-550x0.png|1000px|frameless|center]] | |||
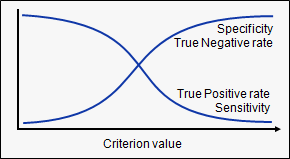
Another, perhaps more intuitive, way of displaying the same information is: | |||
[[File:3124.clip image001.gif-550x0.png|1000px|frameless|center]] | |||
[[Category:Testing the Tests]] | [[Category:Testing the Tests]] | ||
Revision as of 10:30, 29 March 2023
A receiver operating curve (ROC) is a plot of sensitivity versus 1-specificity. The name is derived from its original use in radar technology. The dotted line shown in the ROC curve represents a useless test that has no discriminatory power. The size of the area between the dotted line and the solid line in the ROC curve reflects the ability of a test to discriminate between diseased and non-diseased individuals across the range of potential cut-offs.
Traditional Operating Curve (ROC)

Another, perhaps more intuitive, way of displaying the same information is:
